Products Interactive Data vis Data Stories Web Design
Services Front-end Design Chart Design System Brand Identity
Year 2022
Data Stories communicates the social science and data science methods at the heart of ILLUME’s work.
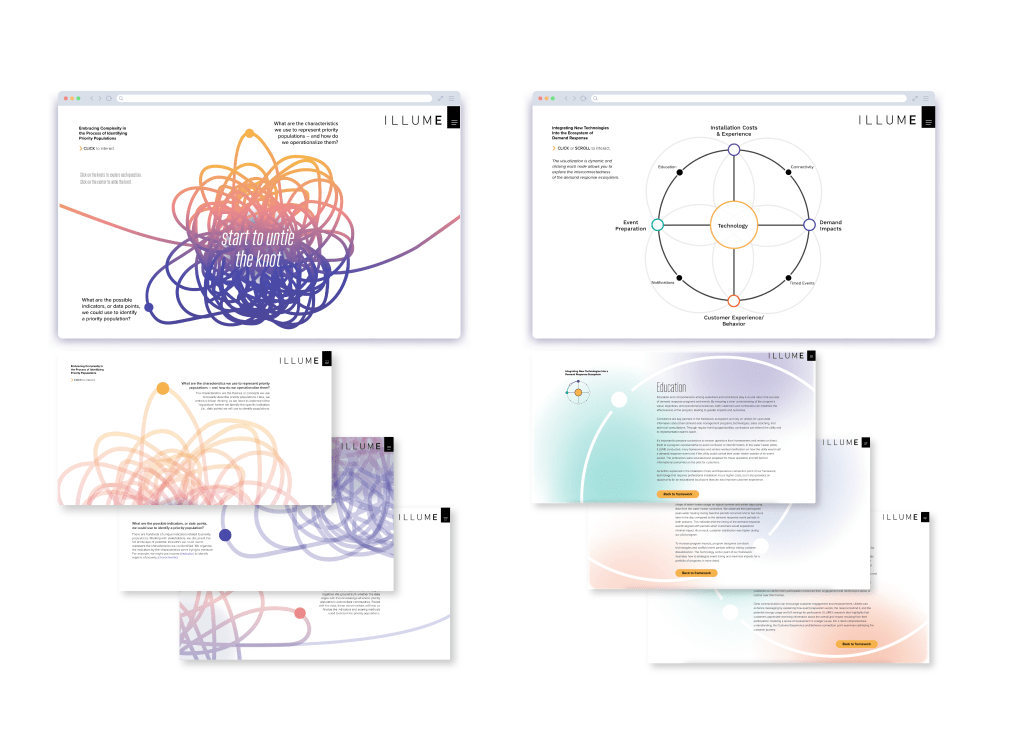
Volume 5, the company’s first fully digital edition, transformed a former print publication into an interactive online platform featuring interactive data visualizations on topics from clean energy initiatives in underserved communities to predictive analytics in energy consumption.
Leading the design, prototyping, user testing, and execution of the platform meant collaboration with project managers, data scientists, analysts, and developers.
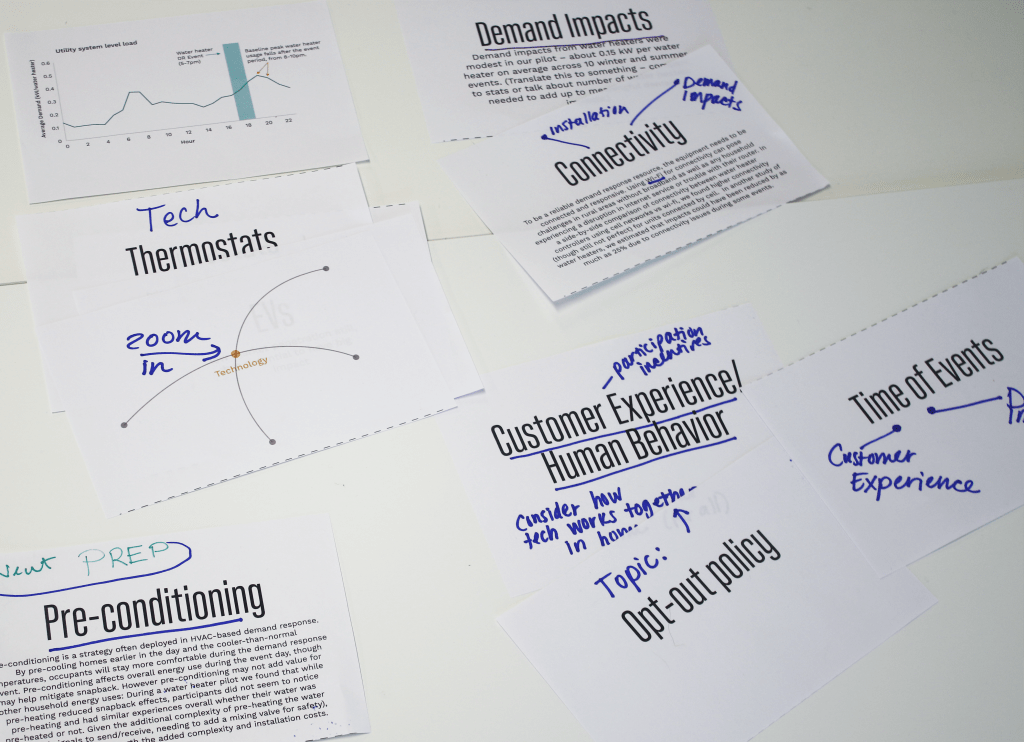
Through interaction and animation, each story invites users into the research process—untangling knots, exploring frameworks, and revealing insights through layered visualizations.
Optimized across devices, the platform turns complex research into an engaging, accessible digital experience.
The ILLUME rebrand introduced a bold color palette, cohesive visual assets, and standardized data vis guidelines. (coming soon)