Product Interactive Data Vis Online and Print Report
Services Design Development Data Vis Guidelines Brand Identity
Year 2024-2025
How can we promote a more nuanced understanding of business environments through non-hierarchical, holistic data structures and visualizations?
We collaborated with the B-Ready team to rethink the forms, layout, and interactivity of their data page visuals.
Instead of ranking economies with a single score, the B-Ready team developed multiple measures across diverse topics and pillars to assess the health and diversity of business environments.
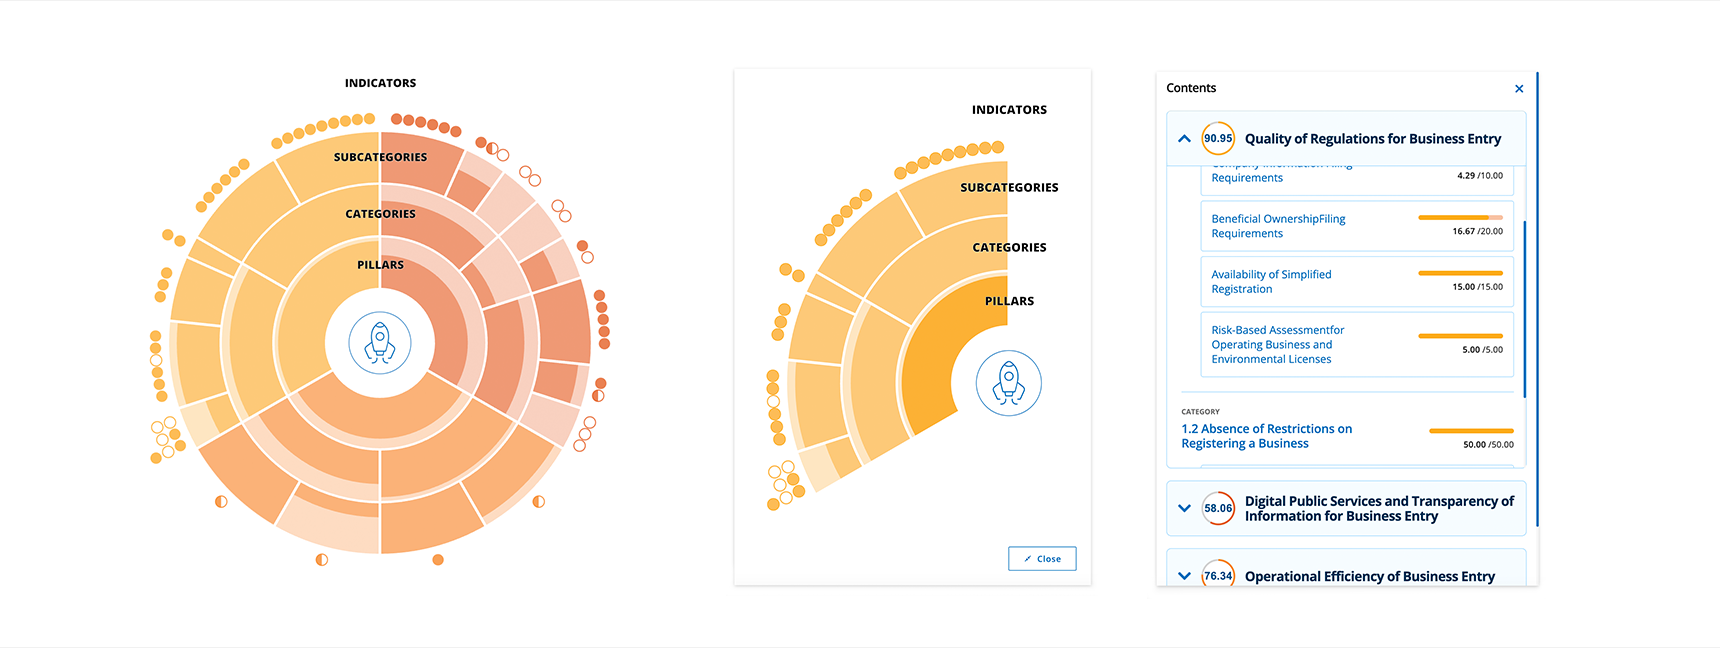
We focused on creating a data structure that allows users to explore information at the most granular level, moving intuitively through nested layers of data—from pillars to categories and subcategories, and beyond.
Our solution introduced circular charts such as donut, parliament, and sunburst charts as anchor visualizations for navigating these layers.
By moving beyond default bar charts and linear comparisons, these visuals encourage open-ended exploration, more nuanced comparison, and a deeper understanding of the data.